
 Facebook
 X
X
 Pinterest
 Copy Link
Covid-19 Impact on Condominium Sales in San Francisco by the Numbers
Click here to view San Francisco’s Real Estate Districts by number and neighborhood.
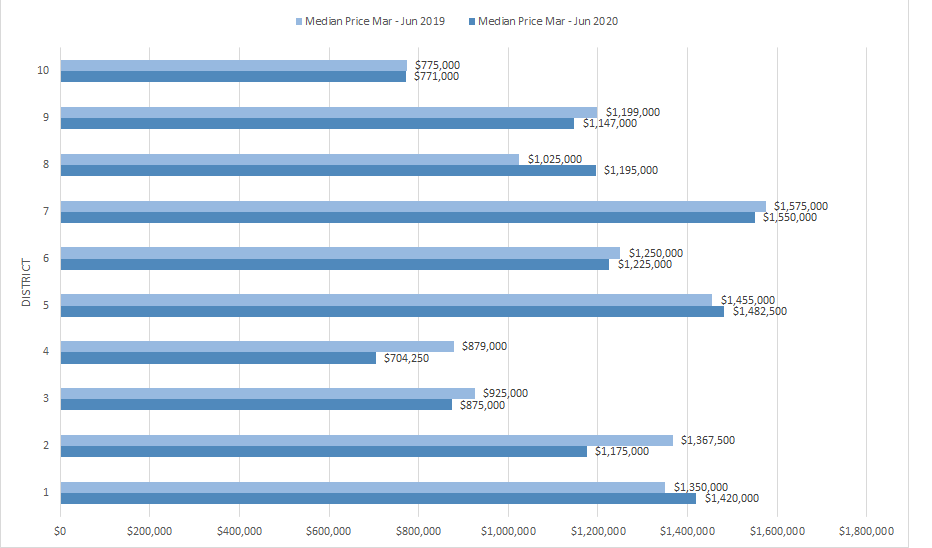
Median Price YTD compared to 2019
The chart above shows the median price for a condominium in each real estate district of San Francisco. It compares prices from March 1, 2020 – June 30, 2020 to the same period in 2019.
UP Districts
Median condo prices are up by 17% in District 8, up 5% in District 1, and 2% higher in District 5.
DOWN Districts
The median price for condos is just 1 – 2% lower in Districts 6, 7, and 10. Districts 2 and 4 are showing declines of 14% and 20%. Districts 3 and 9 are down by approximately 5%.
COVID-19 Impact on the SF Condo Market: Inventory Sold YTD compared to 2019
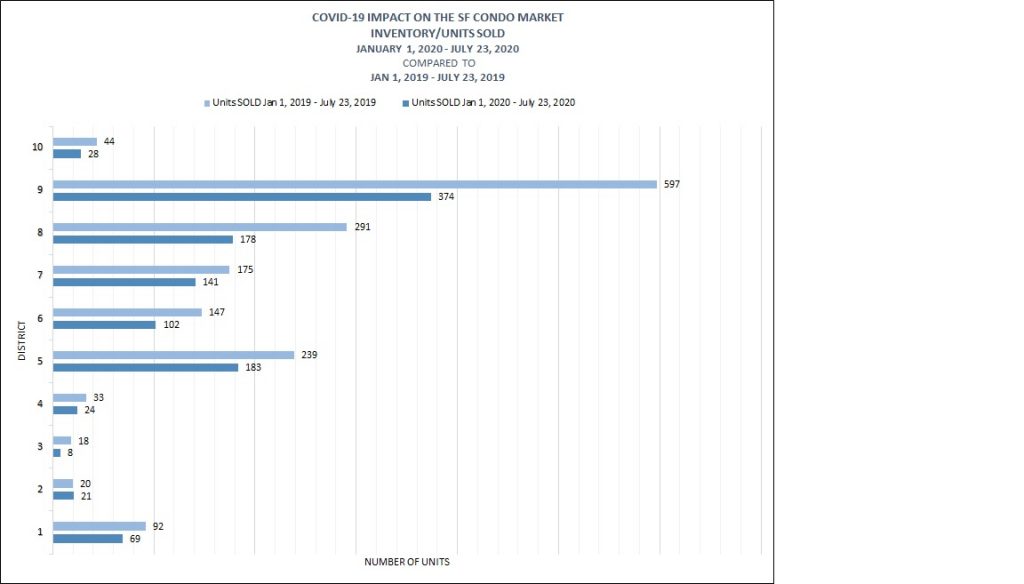
The chart on the above shows the number of condos sold in each district, comparing YTD 2020 to the same period in 2019.
UP Districts
District 2 is the only area where with an increase, and it is just one unit above last year.
DOWN Districts
Every district, with the exception of District 2, is down significantly, from 19% in District 7 to as low as 56% in District 3.


